25 Maps That Make Statistical Data Fun And Interesting
Most of the numbers that describe our world live buried in archived reports and obscure databases that we’d never bother to search for, let alone read. But turn those stats into smart, well-designed maps, and suddenly they become addictive little snippets of insightful trivia distilled in an easily accessible manner.
From where people actually move and settle, to how our habits, jobs, and even quirks cluster across the globe, these informative maps transform dry data into visuals you can grasp in a second and remember for much longer. Here are a few fun data maps shared on a dedicated cartography enthusiasts Reddit community, where art, math and tech are combined to turn obscure statistics into a surprisingly fun format that reveals fascinating stories about the world we live in.
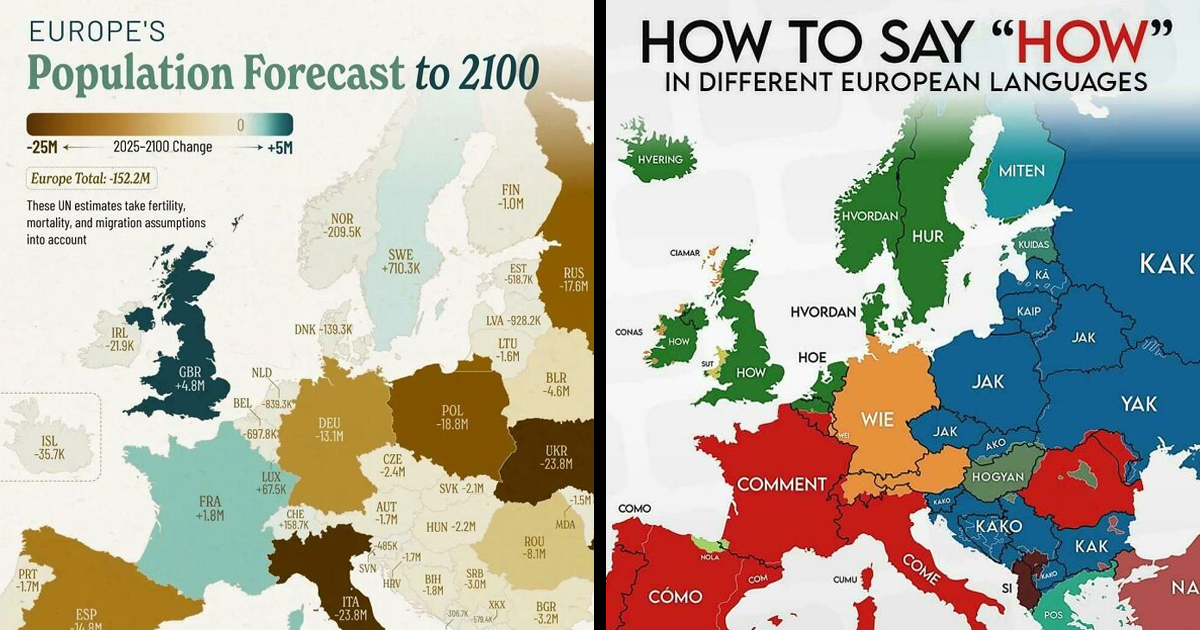
#1 Europe’s Population Forecast To 2100
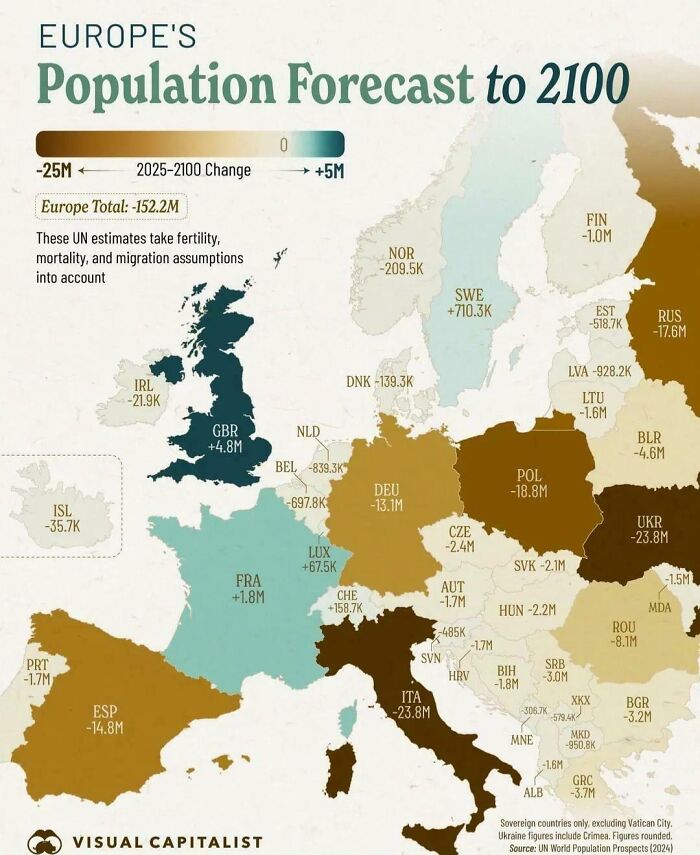
#2 How To Say “How” In Different Languages
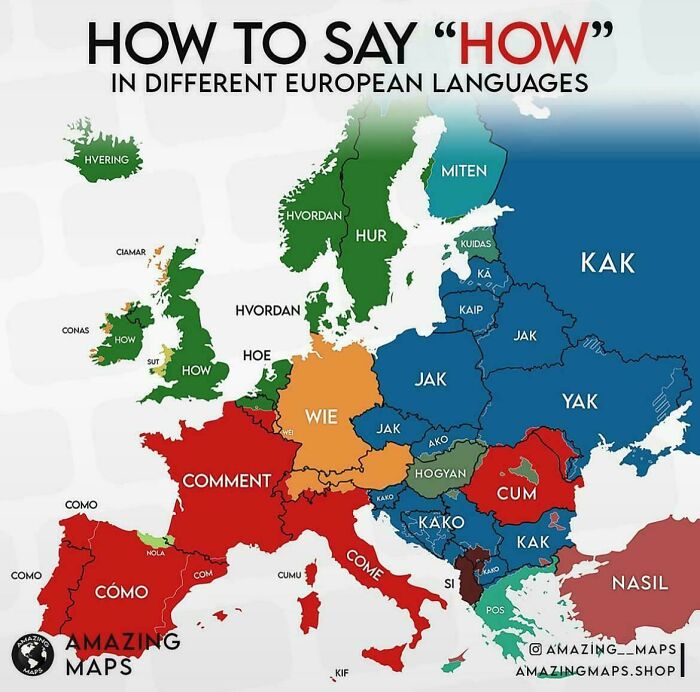
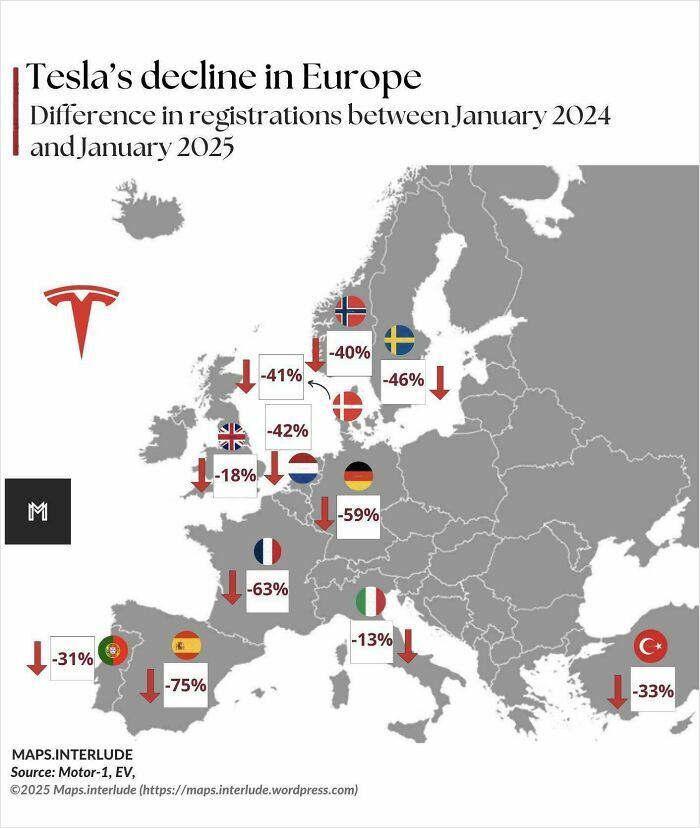
#3 Tesla’s Decline In Europe
#4 Each U.S. State’s Biggest Export Trading Partner

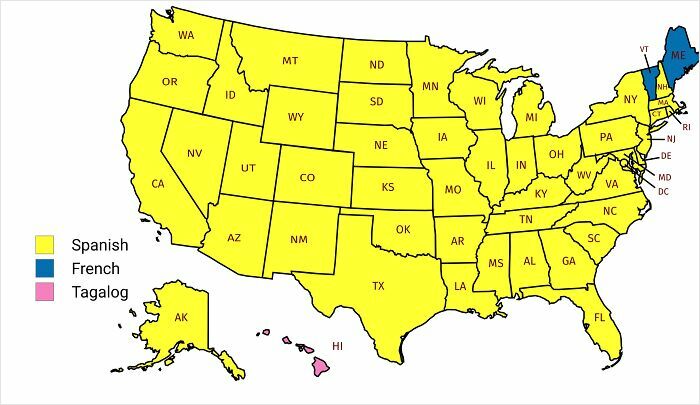
#5 Second Most Spoken Language In Us States
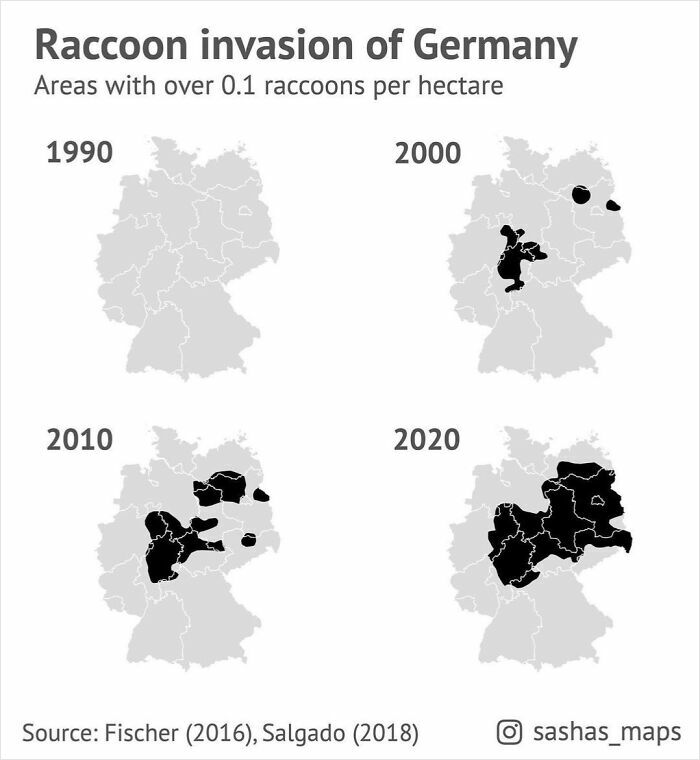
#6 Raccoon Invasion Of Germany In The Past 30 Years
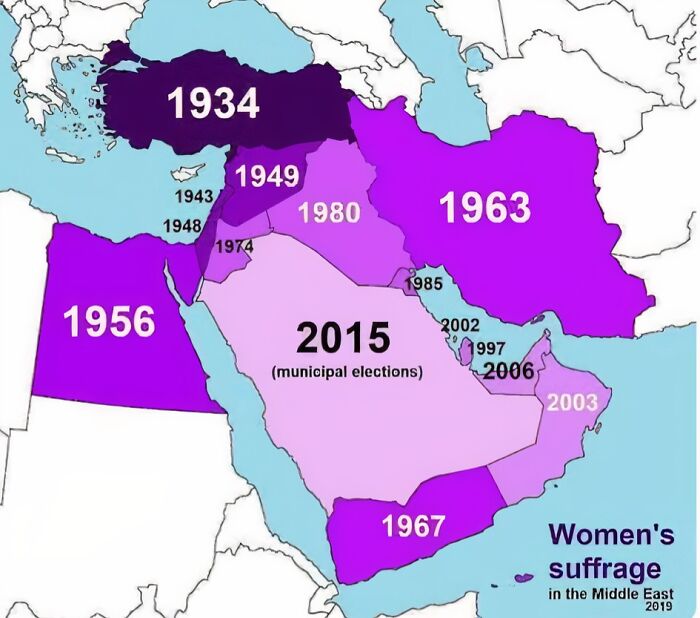
#7 Years Women Got Voting Rights In Middle Eastern Countries
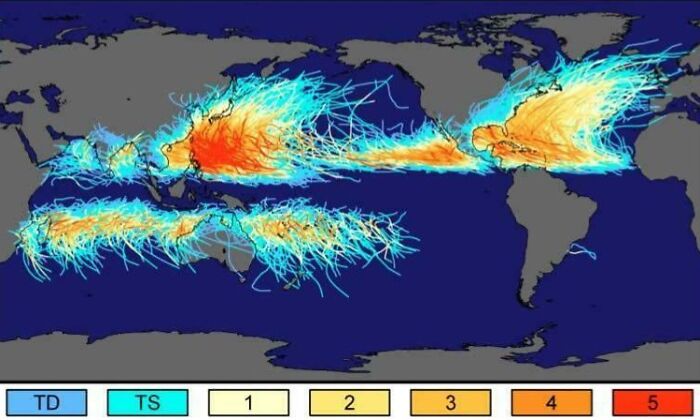
#8 No Hurricane Has Ever Crossed The Equator
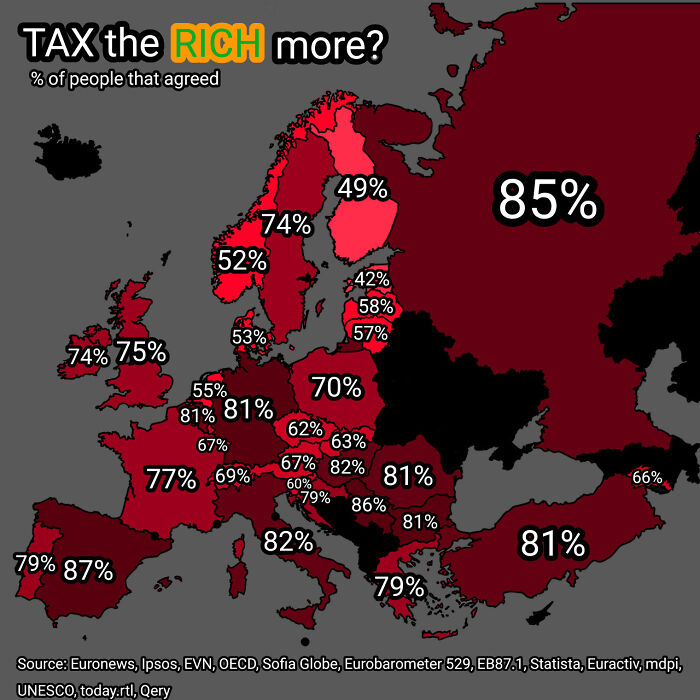
#9 Share Of People In Europe That Want The Rich To Get Taxed More
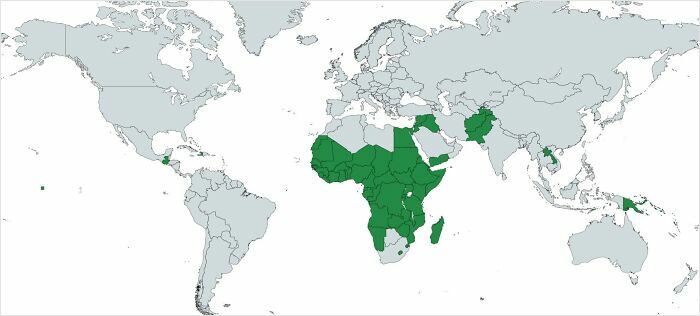
#10 Countries Where Majority Of Population Is Born In 21st Century As Of February 2025 Based On Median Age
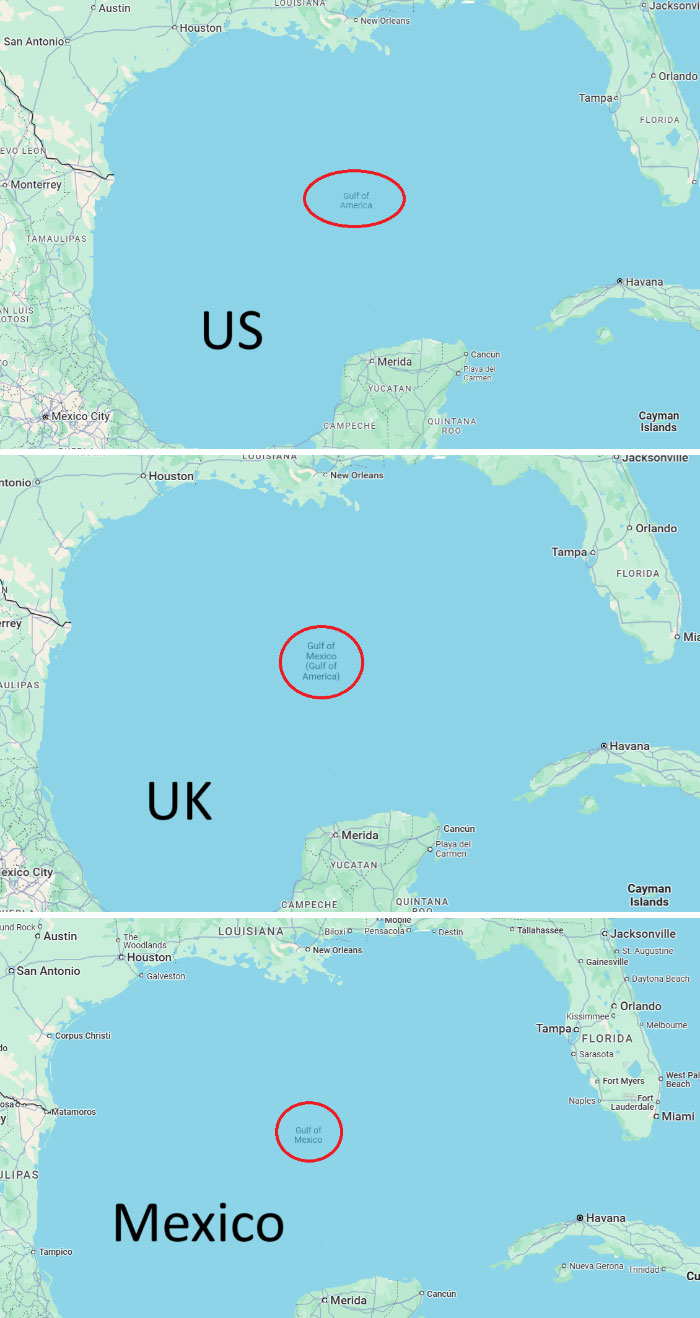
#11 How Google Maps Labels The Gulf Of Mexico (Gulf Of America) In The Us, UK & Mexico
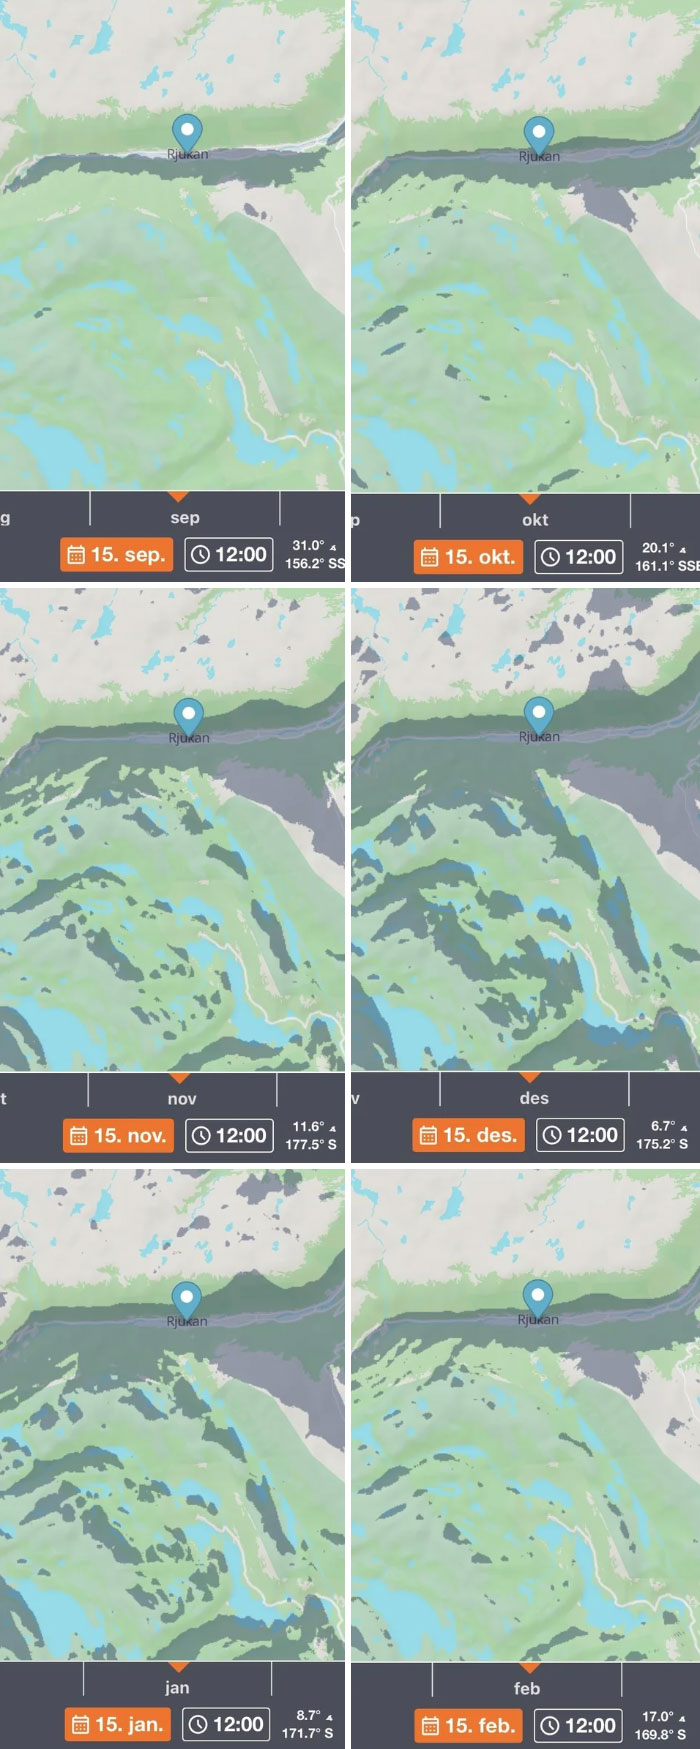
#12 A Town In Norway Is In Shadow For Six Months A Year
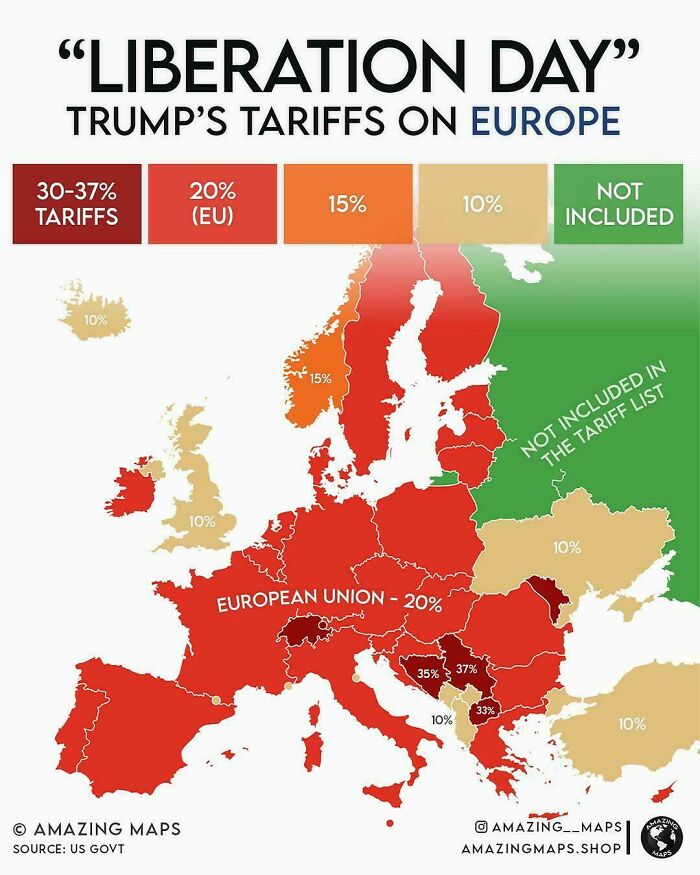
#13 “Liberation Day” Trump’s Tariffs On Europe
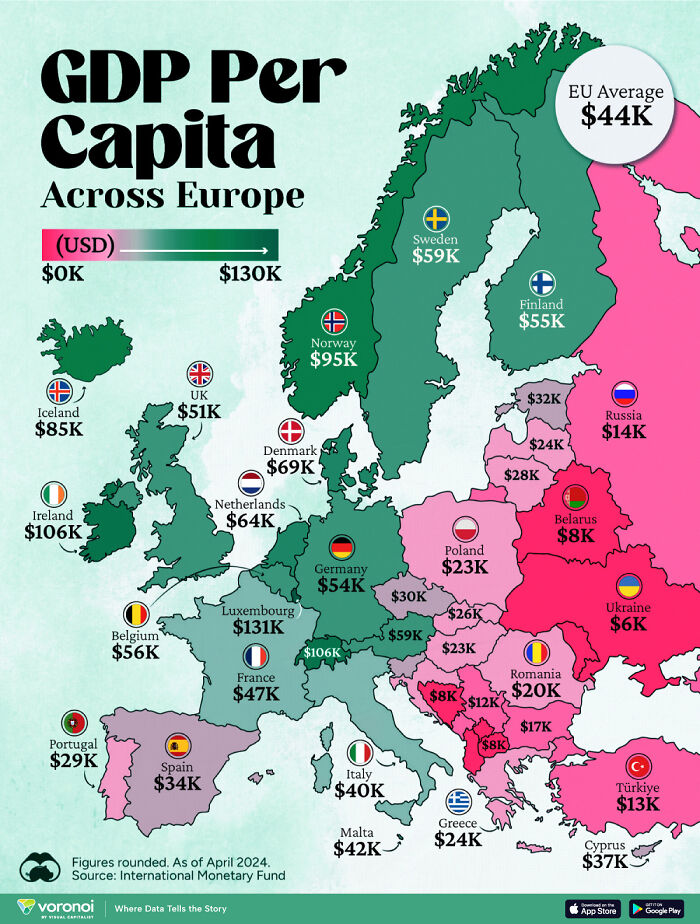
#14 Gdp Per Capita In Europe
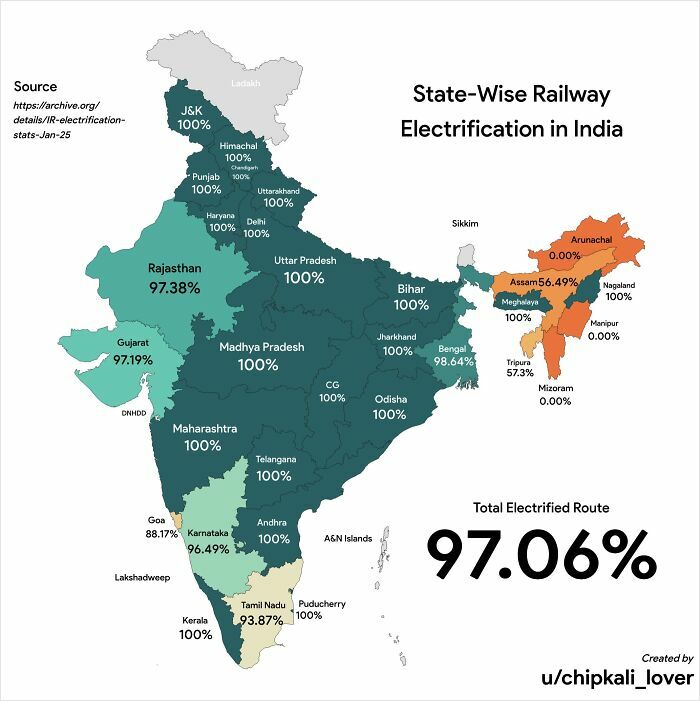
#15 State-Wise Railway Electrification In India
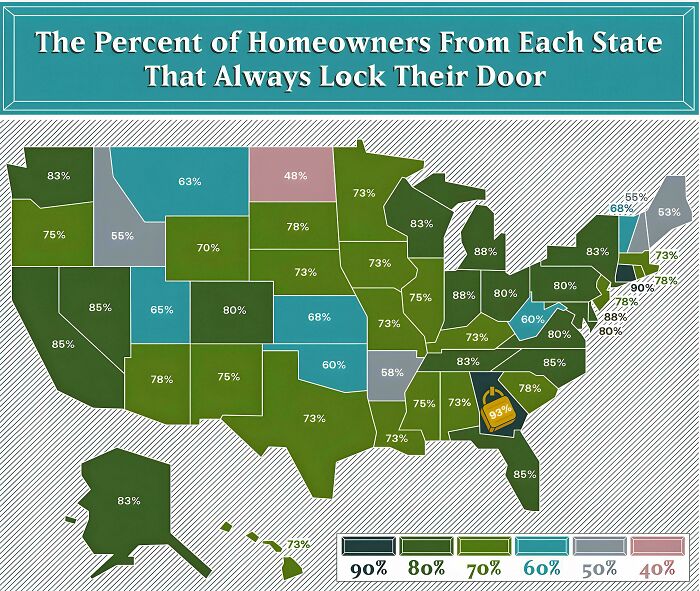
#16 Homeowners That Lock Their Doors In The U.S
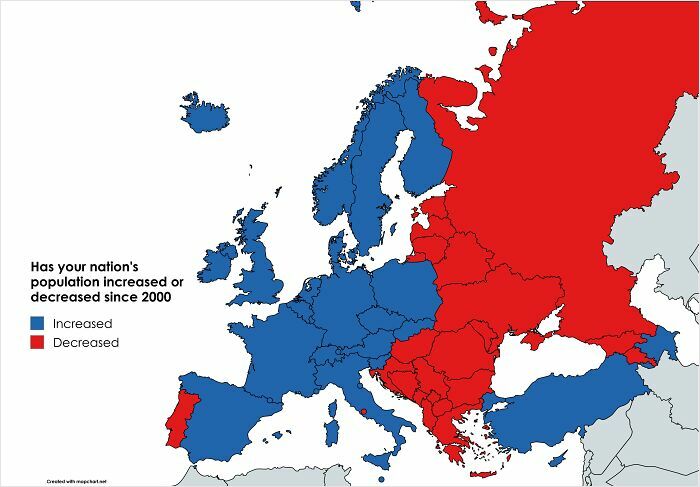
#17 Has Your Nation’s Population Increased Or Decreased Since 2000
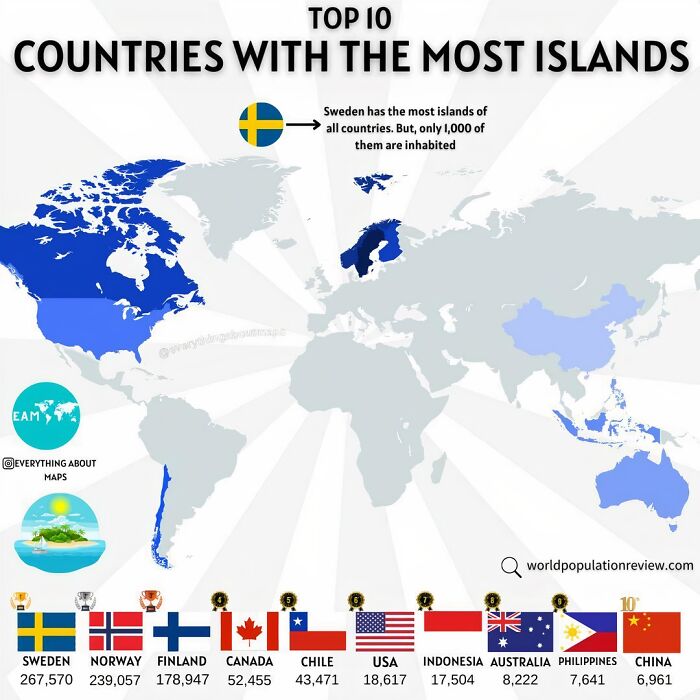
#18 Top 10 Countries With The Most Islands!
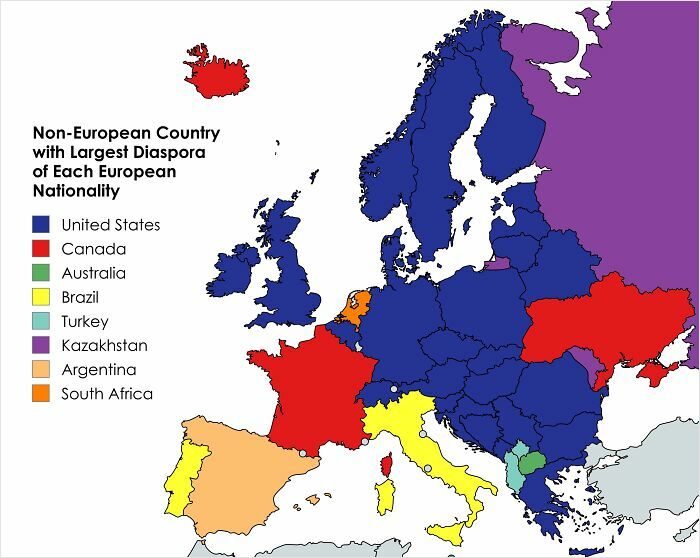
#19 Non-European Country With Largest Diaspora Of Each European Nationality
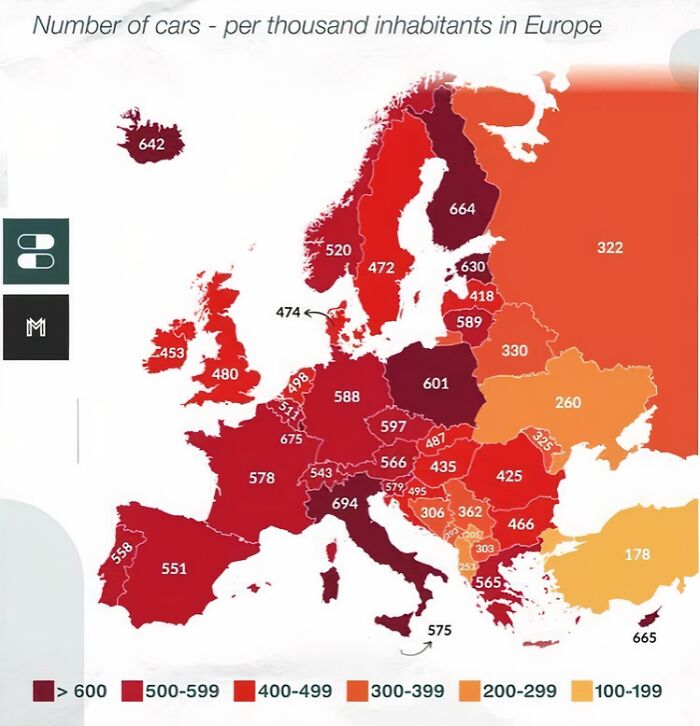
#20 Number Of Cars Per 1000 People In Europe
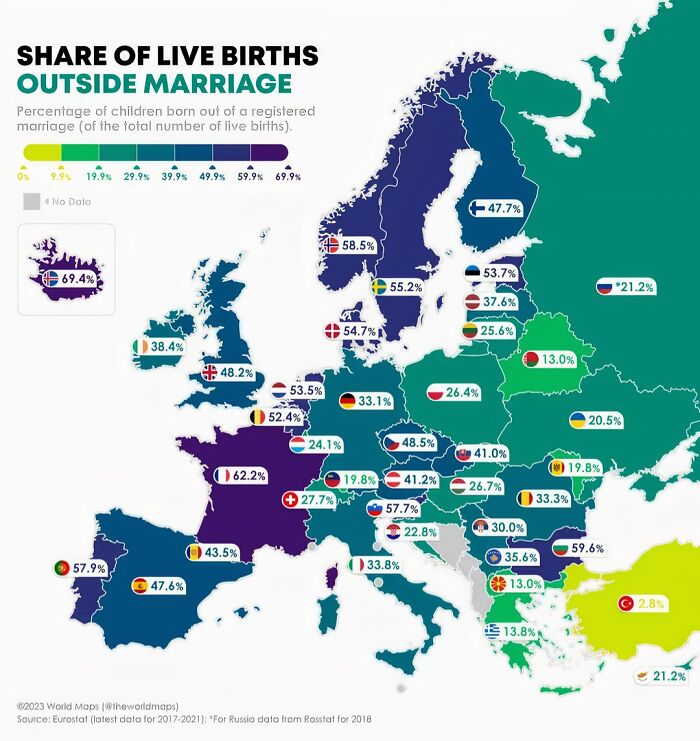
#21 Europe Live Births Outside Marriage
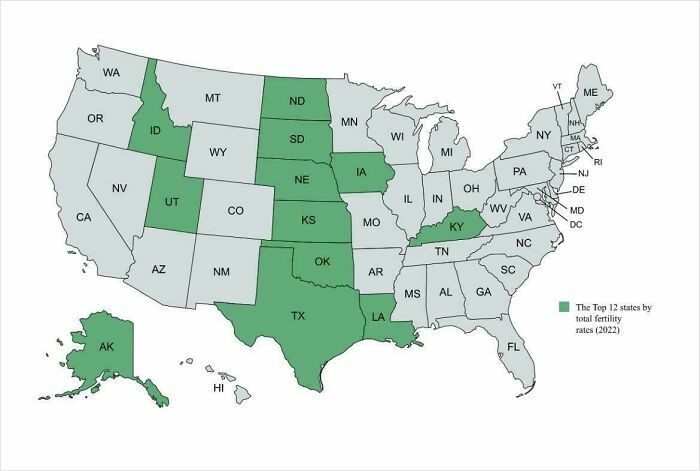
#22 The Birth Belt: The U.s States With The Highest Fertility Rates
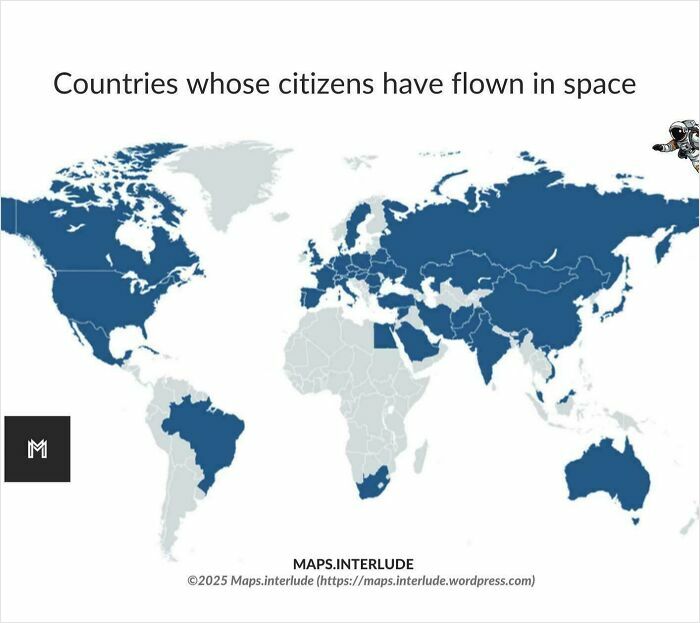
#23 Countries Whose Citizens Have Flown In Space (As Of 2024)
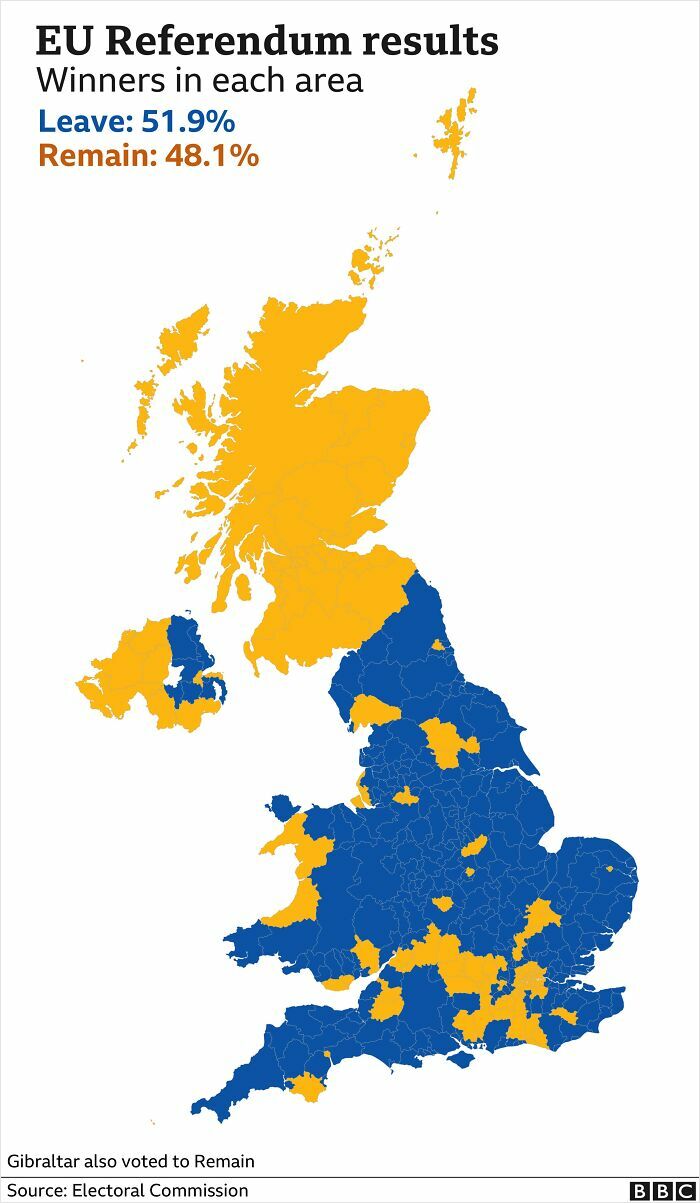
#24 Brexit Vote Results
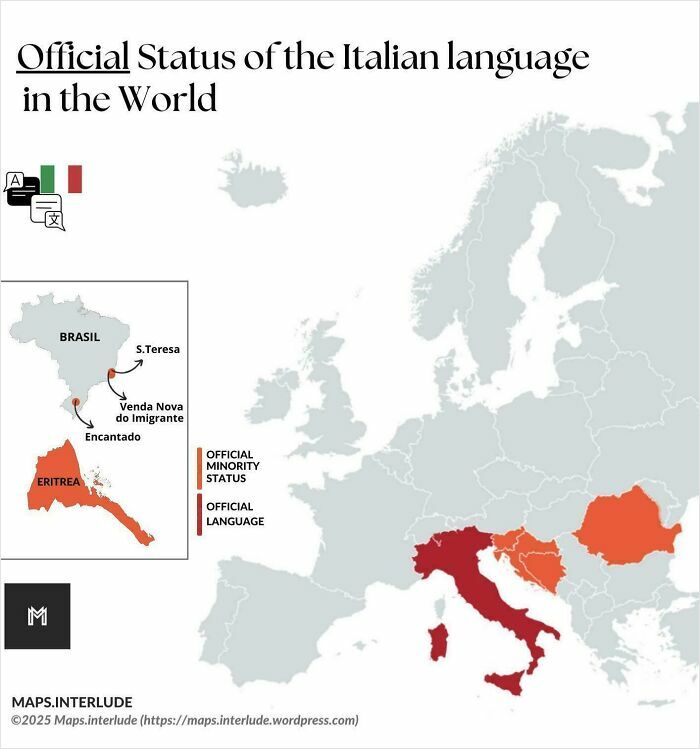
#25 Official Status Of The Italian Language In The World


Shanilou Perera
Shanilou has always loved reading and learning about the world we live in. While she enjoys fictional books and stories just as much, since childhood she was especially fascinated by encyclopaedias and strangely enough, self-help books. As a kid, she spent most of her time consuming as much knowledge as she could get her hands on and could always be found at the library. Now, she still enjoys finding out about all the amazing things that surround us in our day-to-day lives and is blessed to be able to write about them to share with the whole world as a profession.

This 3D Printed Internally Lit Fantasy Armor Is Every Cosplayer’s Dream
Meet Melissa Ng, a New York-based artist, a founder of the Lumecluster wearable art producers, and a person responsible for this amazing 3D-printed, internally lit, medieval-inspired fantasy body armor. Phew, try saying that in one breath…
To make it happen, she spent around 518 hours on designing this fantasy gear on her computer, before 3D printing the durable plastic frame and enhancing it with LED lights.
Melissa has also listened to the feedback that came after her previous armor designs and made this one so it would have the qualities of an actual medieval armor and its beauty wouldn’t rely so much on the feminine figure beneath.
“I made this in honor of the creatives out there who know that, even though it’s empowering to be the ruler of your dreams and creations, you also know how incredibly lonely the journey can often be.”
For the step-by-step process of making this magical armor make sure you visit Melissa’s website .
More info: lumecluster | instagram


Andrius
In cahoots with the secret orde… With nobody. In cahoots with nobody.
This 3D Printed Internally Lit Fantasy Armor Is Every Cosplayer’s Dream
Meet Melissa Ng, a New York-based artist, a founder of the Lumecluster wearable art producers, and a person responsible for this amazing 3D-printed, internally lit, medieval-inspired fantasy body armor. Phew, try saying that in one breath…
To make it happen, she spent around 518 hours on designing this fantasy gear on her computer, before 3D printing the durable plastic frame and enhancing it with LED lights.
Melissa has also listened to the feedback that came after her previous armor designs and made this one so it would have the qualities of an actual medieval armor and its beauty wouldn’t rely so much on the feminine figure beneath.
“I made this in honor of the creatives out there who know that, even though it’s empowering to be the ruler of your dreams and creations, you also know how incredibly lonely the journey can often be.”
For the step-by-step process of making this magical armor make sure you visit Melissa’s website .
More info: lumecluster | instagram
Andrius
In cahoots with the secret orde… With nobody. In cahoots with nobody.
